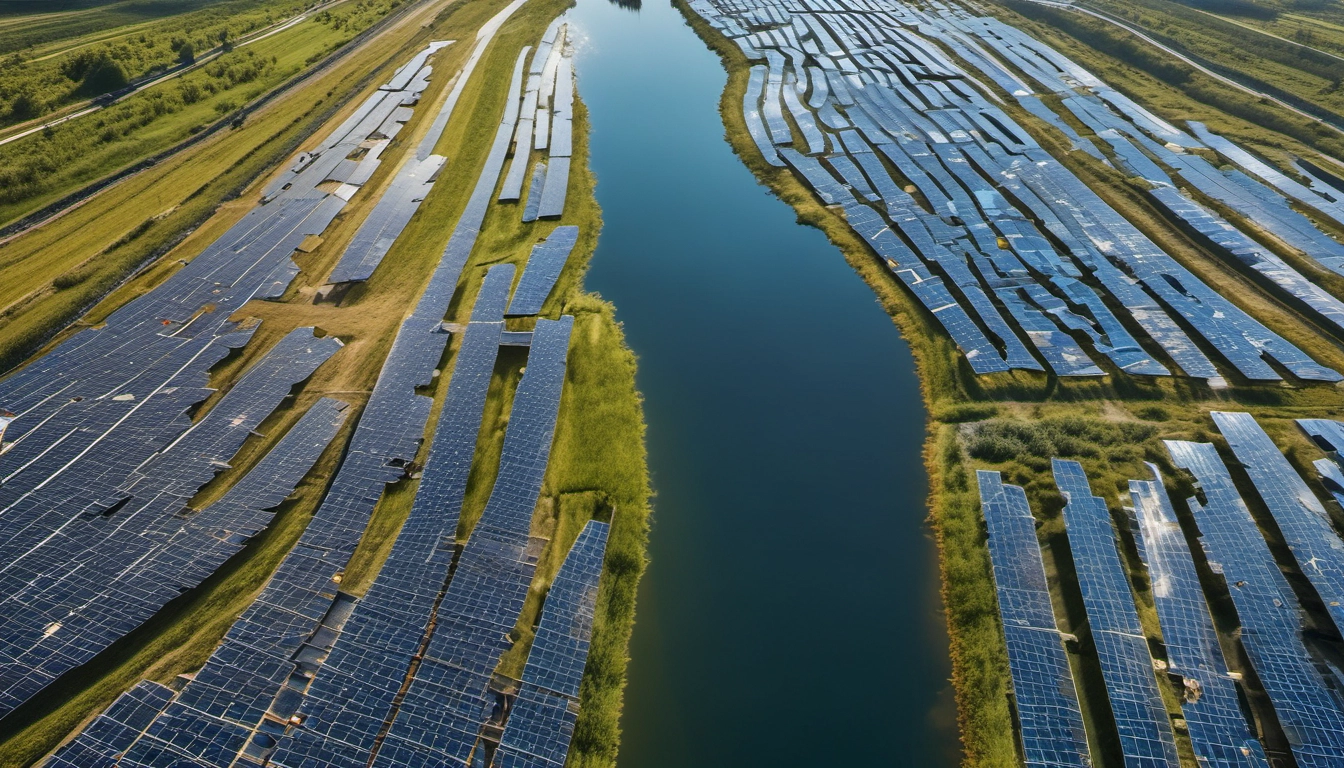
US Solar Market Growth: Data & Forecasts (2025-2030)
Clear, data-led view of U.S. solar growth 2025-2030: key stats, conflicting forecasts, and bull/base/bear scenarios to guide decisions.
Short answer: where U.S. solar stands in 2025
Solar is still growing fast, but experts disagree on how fast from 2025 to 2030. Some reports show strong growth tied to the Inflation Reduction Act and falling costs. Others expect a near-term dip because of policy shifts, tariffs, and grid delays. Below are the headline numbers you need.
- Leading forecasts: Grand View Research projects a 13.7% CAGR for U.S. solar PV from 2023–2030, reaching about $96.6 billion by 2030.
- Near-term jump: The EIA forecasts U.S. solar generation will grow 75% from 2023 to 2025.
- Base case caution: The SEIA with Wood Mackenzie expects the industry to add ~43 GWdc per year on average through 2030, and a small contraction of about 2% annually in some scenarios.
- Policy risk: News reports and trade-group forecasts warn that tariff moves and changes to tax credits could lower installations later in the decade (Reuters).
Key statistics dashboard
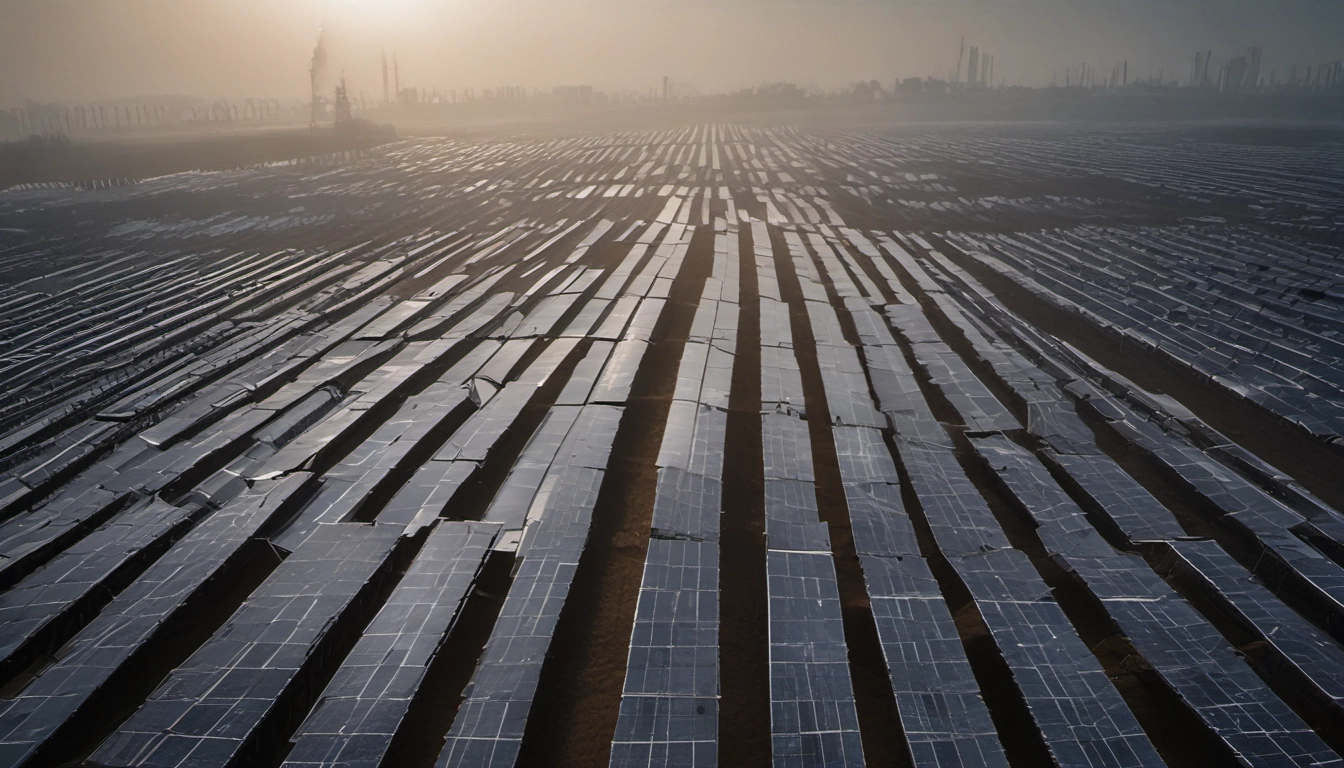
- Total U.S. solar capacity (2024/2025): ~255 GW (SEIA reported ~255.4 GW).
- Installed systems: ~5.7 million systems (SEIA).
- Solar jobs (2023): ~279,447 (Solar Jobs Census).
- H1 2025 utility-scale additions: 12 GW added; developers planned 21 GW more in H2 2025 (EIA).
- Small-scale share: ~28% of 2024 solar generation came from small-scale systems (Climate Central).
Why forecasts conflict
Different assumptions drive different outcomes
- Policy baseline: Some forecasts assume full continuation of IRA/ITC incentives and safe-harbored projects. Others assume policy rollbacks or reduced credits.
- Tariffs and trade actions: Recent duties and tariff threats on imported modules and cells change costs and timing for projects (DOE update).
- Grid limits and interconnection: Delays in connecting projects to the grid slow deployment in many regions.
- Manufacturing shifts: Domestic manufacturing growth can speed deployment if paired with incentives; but manufacturing needs federal support to scale fast.
Growth drivers vs. market headwinds
| Growth drivers | Market headwinds |
|---|---|
| Strong economics: falling panel and balance-of-system costs | Tariffs and trade restrictions raising equipment cost |
| Federal incentives (IRA, ITC) and safe-harbor rules | Policy uncertainty and potential tax-credit changes |
| High corporate and data center demand (AI + cloud) | Interconnection delays and permitting bottlenecks |
| Storage pairing makes solar dispatchable | Labor shortages and supply-chain friction |
2030 scenarios: bull, base, and bear
Bull case (policy stays supportive)
- Assumptions: IRA credits remain, tariffs are manageable, interconnection improves.
- Outcome: Strong installations, similar to Grand View’s growth path (double-digit CAGR in market value), high manufacturing investment, and >300 GW+ deployed by 2030 in cumulative capacity.
Base case (current trends + partial headwinds)
- Assumptions: Some tariffs and delays, but core IRA benefits and safe-harbored projects complete.
- Outcome: Industry adds ~40–45 GWdc per year on average through 2030 (SEIA base case). Market growth moderates but stays positive overall.
Bear case (policy rollback & stricter trade/permits)
- Assumptions: Major tax-credit changes, tighter federal permitting, heavier tariffs.
- Outcome: Installations shrink compared with 2025 levels; forecasts show declines in new capacity additions and lower cumulative capacity versus base case (some reports expect 2030 installs >10% lower than 2025).
What this means for common users
- Investors: Watch policy signals and tariff rulings. Short-term volatility is likely; long-term demand for clean power remains strong.
- Manufacturers: Prioritize safe-harbored contracts and domestic content rules to capture bonus credits.
- Developers: Plan for interconnection lead times and consider pairing with storage to improve project value.
- Policymakers: Clear, stable incentives and streamlined permitting unlock faster build-out and jobs growth.
Practical guidance & one ROI insight
ROI insight: For many businesses and institutions, on-site solar paired with incentives can cut electricity bills sharply and often reaches simple payback in roughly 4–8 years, depending on local power rates and incentives. That improves project returns and makes investments easier to justify.
Implementation tip: Secure tax-credit safe harbor or begin construction before major policy deadlines. For developers, lock long-lead equipment early and start interconnection studies as soon as possible.
Quick checklist for stakeholders
- Track federal policy and tariff updates (Reuters).
- Model multiple scenarios (bull/base/bear) for 2025–2030 cash flow planning.
- Prioritize projects with storage to increase value and grid reliability.
- For manufacturers: apply for grants and incentives that support domestic capacity growth.
Sources and further reading
- EIA: Solar and wind growth to 2025
- SEIA: Solar Market Insight
- Grand View Research: U.S. Solar PV Market
- DOE Quarterly Solar Industry Update
- Reuters coverage on policy risk
Bottom line
Solar still has a strong growth story in the U.S., but the path from 2025 to 2030 is uncertain. The difference between a high-growth decade and a slower one comes down to policy certainty, tariffs, and the grid's ability to connect projects. Use scenario planning, secure incentives early, and include storage to make projects more resilient.
"Policy and permitting choices this decade will decide how fast solar scales to meet rising electricity demand."
FAQ
Will solar pass wind in the U.S.?
Yes. Recent data shows solar additions outpacing wind in 2025, and some sources expect solar to surpass wind as a share of generation soon (pv magazine).
Should I invest now?
Consider a staged approach. Short-term policy shifts create risk, but long-term demand for clean power and electrification trends make solar a strategic sector. Watch IRA/ITC rules and tariff decisions closely.

Marcus helps organizations implement sustainable practices and evaluates emerging green technologies. Former renewable energy engineer with 15+ years in clean tech industry.