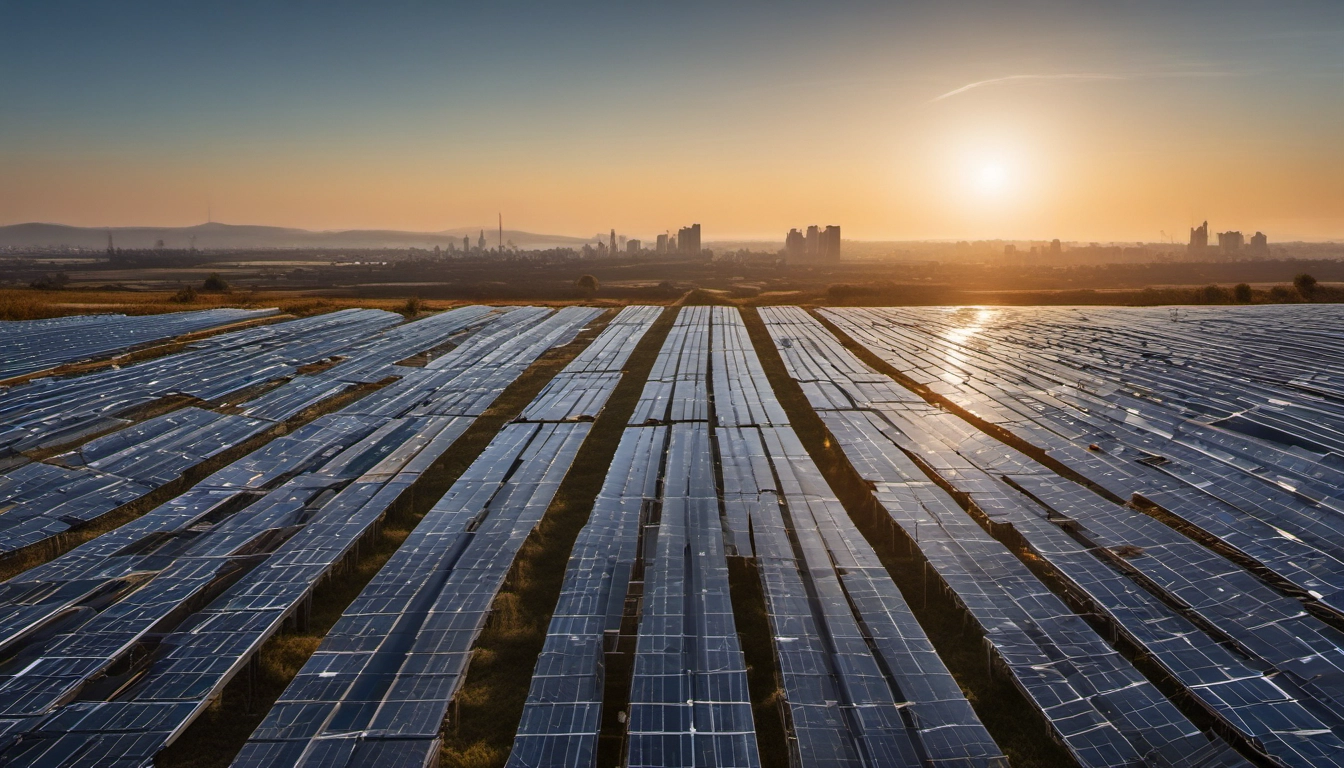
Germany April 2025 Solar Drop: What It Means Now
Germany added 838.5 MW in April 2025. This explainer shows why, what it means for the 2030 target, and a 5-step checklist for installers and policymakers.

Short answer: April 2025 fell but it is fixable
Germany added 838.5 MW of new solar in April 2025, down 19.4% from April 2024 but slightly up from March 2025. The drop points to short-term issues — seasonality, policy changes and grid delays — not the end of Germany's solar boom. Read the simple checklist below to act this quarter.
What happened in April 2025?
Official monthly figures show 838.5 MW added in April 2025, versus 1,040 MW in April 2024 and 820.2 MW in March 2025. Year-to-date (Jan Apr) installations were about 4.65 GW, down from 4.98 GW a year earlier, while cumulative capacity reached about 104.9 GW by end-April. These numbers come from the Federal Network Agency data covered in industry reporting.
Why monthly totals can drop (four quick causes)
- Seasonality: Spring months vary a lot for construction and grid work.
- Policy shifts: Subsidy and regulatory changes in 2024 25 slowed some buying decisions, as noted in wider EU reporting (Reuters).
- Grid and connection delays: More projects are waiting for grid links or permits, which batches completions into uneven months.
- Market churn: Firm-level bankruptcies and supply-chain moves can pause installs in key regions (PVKnowhow).
Distributed solar matters
Balcony PV and rooftop systems keep the market resilient: April saw about 53 MW from balcony systems and 449.4 MW from rooftop installs, showing that small-scale, distributed solar is a growing share of additions (source).
Does this jeopardize the 2030 EEG target?
Germany aims for 215 GW of solar by 2030 under the EEG. Use this quick formula to check pace:
Monthly GW needed = (Target GW - Current GW) / Months remainingExample with April 2025 data: Target 215 GW Current ~104.9 GW = ~110.1 GW remaining. Months from May 2025 to Dec 2030 = 68 months. Required pace ≈ 110.1 / 68 ≈ 1.62 GW per month. That is above the April pace and near the 1.5 GW/month often cited as the practical minimum to stay on track.
Regional snapshot (top states YTD to April 2025)
| State | YTD additions (approx.) |
|---|---|
| Bavaria | 835 MW (Strategic Energy) |
| North Rhine-Westphalia | 460 MW (Strategic Energy) |
| Other states | Smaller shares; some near zero in April |
Five quick actions: checklist for this quarter
- Push small-scale installs: Prioritise rooftop and balcony PV marketing and fast-track small permits. These added 500+ MW in April and are quicker to deploy.
- Fix grid bottlenecks: Work with TSOs and distribution networks to reserve connection slots and offer staged grid tests.
- Stabilise incentives: Policymakers should make short-term, clear rules for feed-in and self-consumption to reduce buyer paralysis (Reuters).
- Offer finance+storage bundles: Installers: pair panels with low-rate loans and battery options to lift sales; households are likelier to buy when payback is clear.
- Monitor pipeline data weekly: Track permitted but unbuilt MW and expected grid dates; this reveals true monthly delivery risk.
Installer ROI insight & implementation tip
ROI insight: Bundling storage and financing raises average order value and can cut payback time, helping close sales now. Implementation tip: Start with one pilot region and one finance partner; use measured results to scale quickly.
What investors and developers should watch
- Contract termination and grid queue depth are early warning signs for delays.
- Large ground-mounted projects can smooth totals but need grid upgrades and long lead times.
- Distributed solar growth means more steady cash flows from many small systems vs. lumpy utility projects.
Quick FAQs
- Is solar growth stopping in Germany? No. Annual and cumulative growth remains strong, but monthly numbers can wobble. See long-term context from Ember and BNetzA reporting.
- How fast must capacity grow? Roughly 1.6 GW/month from May 2025 to hit 215 GW by 2030 using current numbers.
- Where to get the monthly data? See the monthly breakdown reports and industry summaries linked above for source tables.
Need the state table or a simple calculator? See the official monthly coverage and industry summaries linked in this article for downloads and deeper tables (BNetzA summary, PVKnowhow, Strategic Energy).
Author note: Small, fast wins (rooftop, balcony PV, bundled finance) can restore monthly momentum. Green upgrades also improve margins: start a pilot offering battery finance in one region this quarter to see quick ROI.


